Using leading and lagging assets in a trading strategy involves analyzing the performance of related assets where one tends to move first (leading) and the other follows (lagging). This strategy is based on the idea that certain assets are correlated in such a way that one asset’s price movement can predict the movement of another asset.
Here’s how this concept works:
1. Leading Asset:
-
A leading asset is one that tends to make a move before a related asset. For example, in currency pairs or commodities, a leading asset might show price movement or trend changes earlier than the lagging asset. Traders use the leading asset to predict what might happen with the lagging asset.
2. Lagging Asset:
-
A lagging asset is one that follows the leading asset’s movements, either in the same direction or an opposite direction (depending on correlation). Traders use the lagging asset to confirm the move initiated by the leading asset or capitalize on it.
Example of Leading and Lagging Assets in Practice:
-
Currencies: Let’s say you’re trading EUR/USD and GBP/USD. If EUR/USD often moves before GBP/USD due to the broader influence of the Euro on European economies, you could watch the movement of EUR/USD (leading asset) to predict the movement of GBP/USD (lagging asset).
-
-
If EUR/USD rises, you might anticipate GBP/USD will follow the same trend.
-
Your strategy could involve buying GBP/USD after observing a significant move in EUR/USD.
- EURUSD is leading in this chart for GBPUSD to follow up Ideal buy setup.

- GBPUSD has risen significantly after having that lag.

-
-
For instance, oil prices (leading asset) might move first, and then oil company stocks (lagging asset) could follow. If oil prices rise sharply, a trader might expect the stock prices of oil companies to follow and buy those stocks in anticipation.
Commodities and Stocks: In commodity-based stocks, the price of the commodity often acts as the leading asset, while the stock of companies producing that commodity acts as the lagging asset.
Fore example Using GOLD as a leading chart for GBPUSD buy setup
-
Before
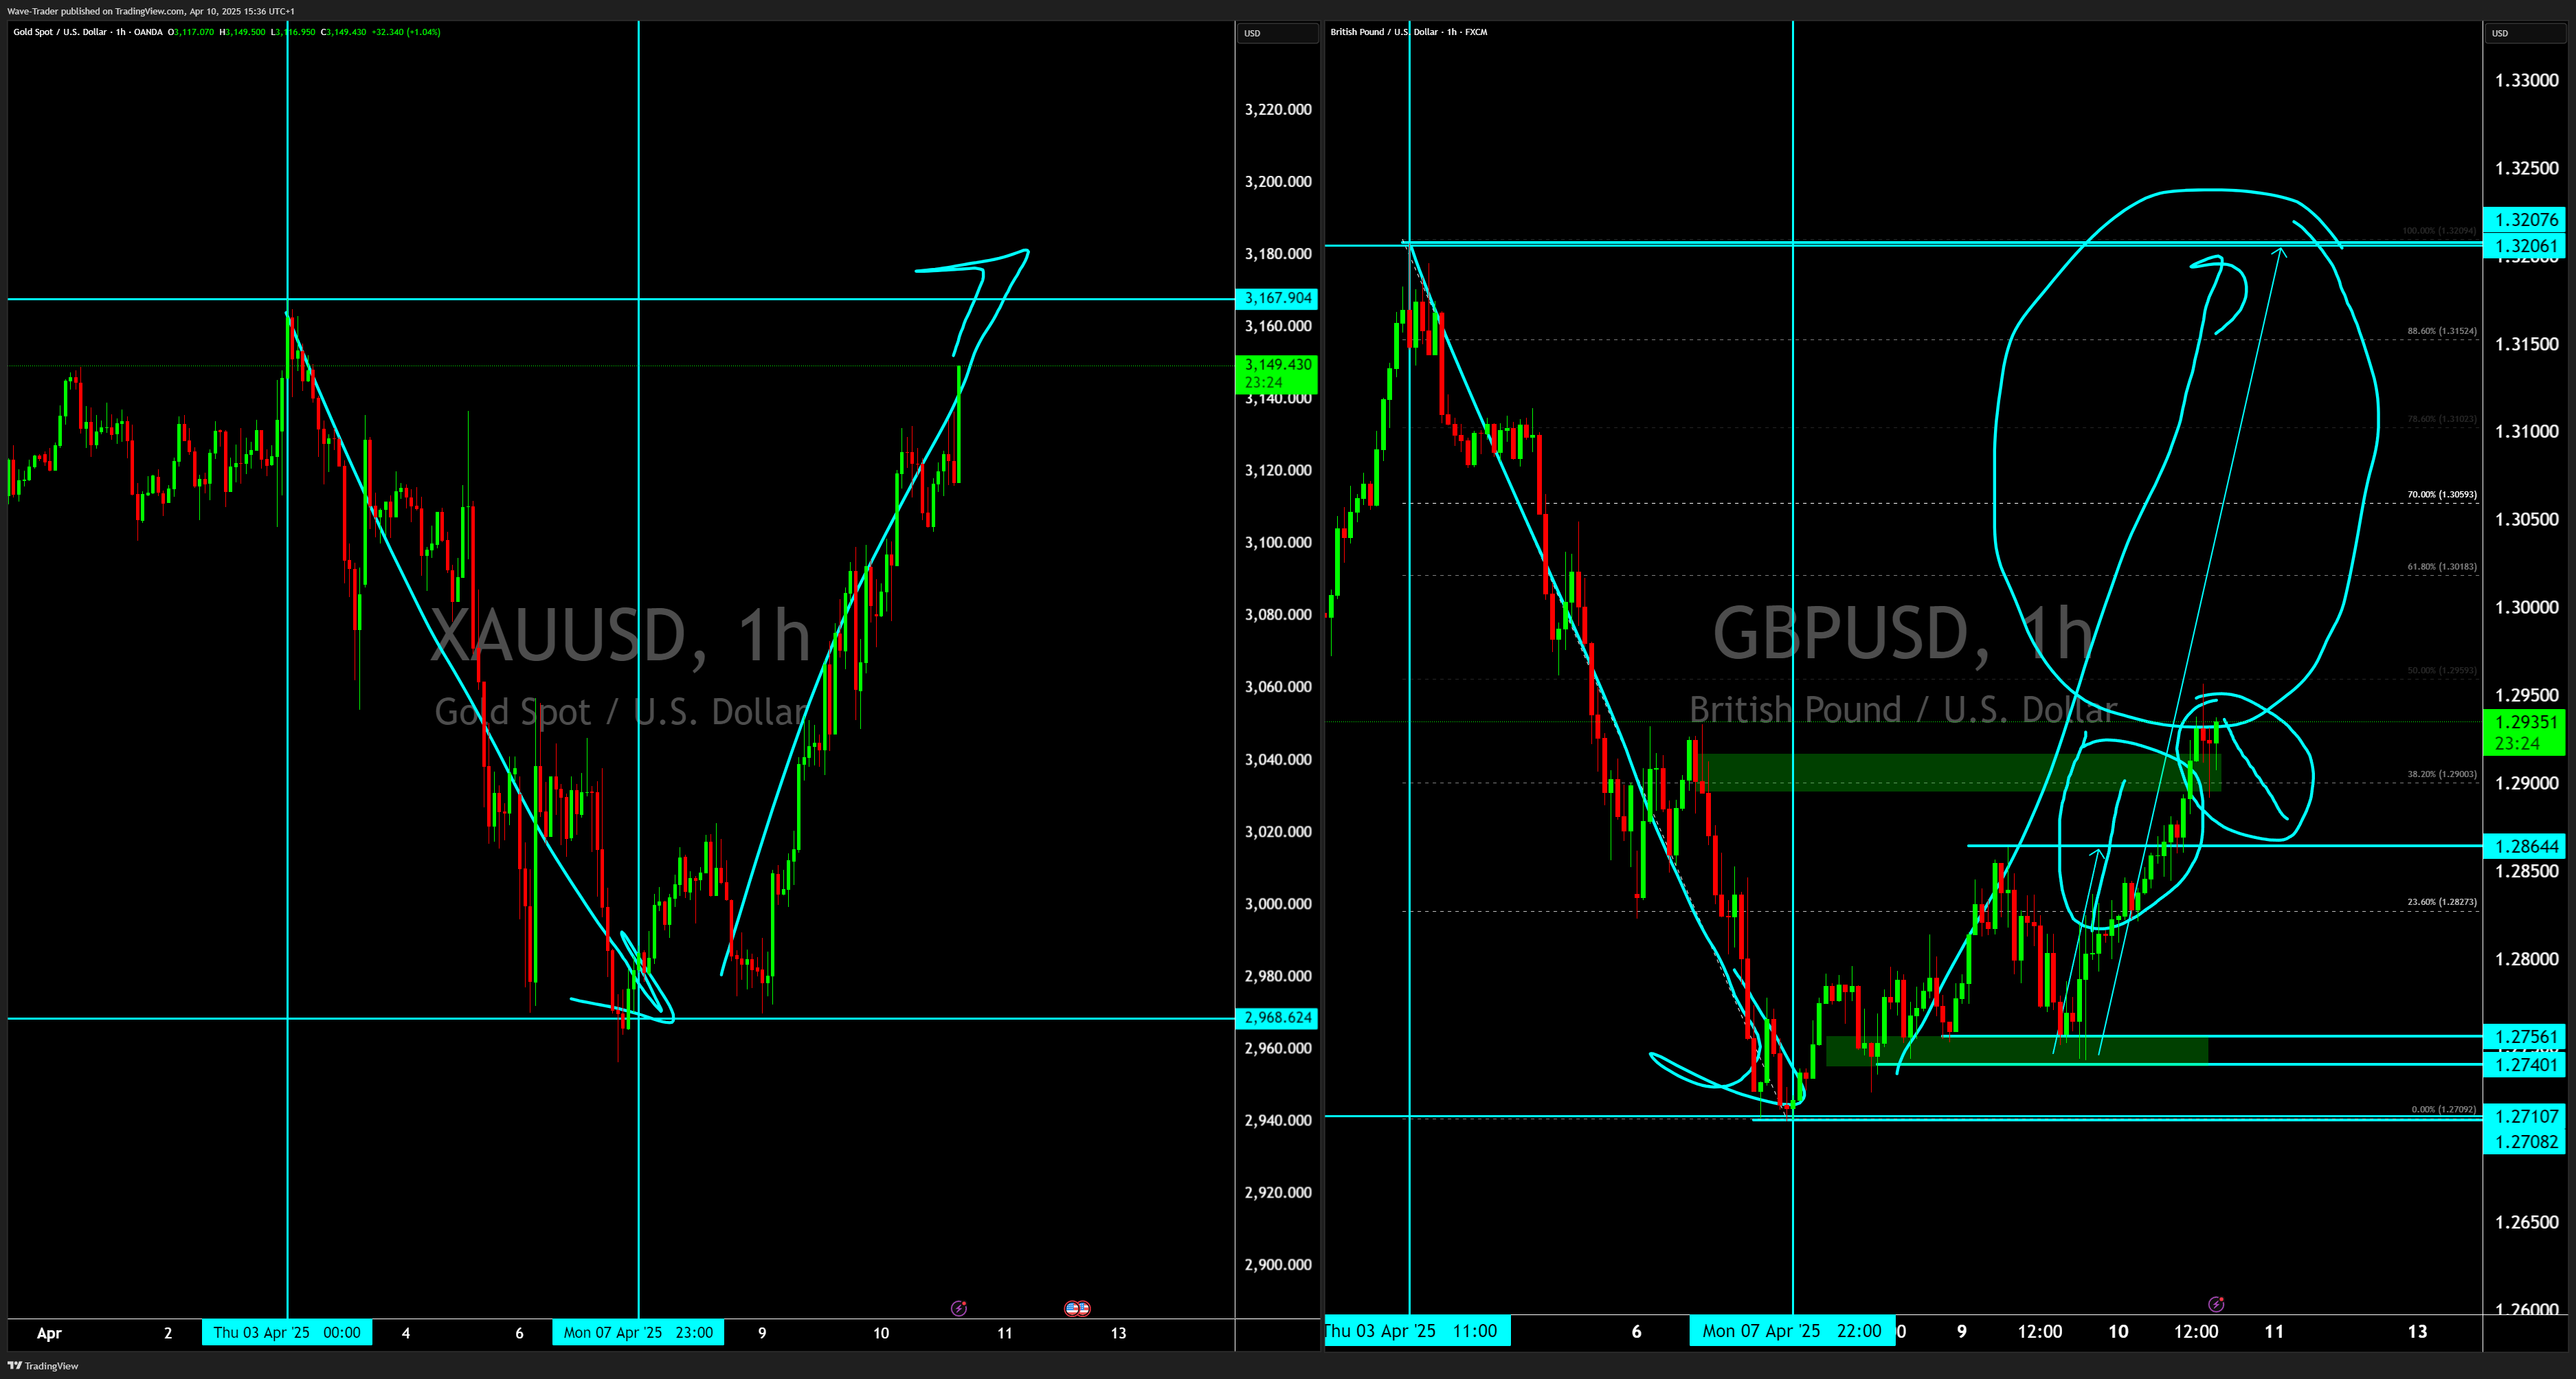
-
- After

-
Stock Market Indices: In some cases, smaller or regional stock indices can act as leading indicators for larger indices.
-
For example, the Nikkei 225 (Japan) might move earlier in the trading day compared to the S&P 500 (U.S.), and traders can use the Nikkei’s movement as a leading indicator for what might happen in the U.S. market.
-
Key Components of the Strategy:
-
Correlation: The assets must have a strong historical correlation (positive or negative). Traders must identify assets that reliably move in tandem or in opposition to one another.
-
Positive Correlation: The leading and lagging assets move in the same direction.
-
Negative Correlation: The leading and lagging assets move in opposite directions.
-
-
Time Lag: There should be a discernible time lag between when the leading asset moves and when the lagging asset follows. This time lag creates the opportunity for the trader to act.
-
Asset Selection: Choosing the right pair of leading and lagging assets is crucial. Common examples include:
-
Currencies (e.g., EUR/USD and GBP/USD, as you’ve worked with before).
-
Commodities and related stocks (e.g., oil prices and oil company stocks).
-
Sector rotation: Some sectors might move before the broader market, providing leading signals.
-
-
Risk Management: Because the strategy relies on the assumption of consistent correlation and time lag, risk management is essential to avoid losses when the relationship breaks down or becomes inconsistent.
Example of a Trading Scenario:
-
Currency Pairs: Let’s say EUR/USD has just broken a resistance level, signaling a bullish trend. GBP/USD, which is correlated, has not moved yet. You could enter a long position in GBP/USD, expecting it to follow the upward movement of EUR/USD. Your trade is based on the expectation that GBP/USD is the lagging asset and will follow EUR/USD’s trend.
-
Scalping Strategy Using Leading and Lagging Currency Pairs (3-Minute Time Frame)
For effective scalping, you can monitor four major currency pairs—AUD/USD, NZD/USD, GBP/USD, and EUR/USD—on a 3-minute chart to identify leading and lagging relationships. These pairs can help uncover high-probability trade setups based on the sequential flow of price movements.
Chart Setup:
The chart template should include all four pairs displayed simultaneously, allowing quick visual comparison to identify momentum shifts and confirm market direction.
Trade Setup Logic:
The most reliable and high-probability scalping opportunities often arise in a specific sequence, particularly during risk-off conditions in the broader market:
-
EUR/USD begins to drop first.
-
GBP/USD, which is closely correlated with EUR/USD, follows the move.
-
NZD/USD then starts to decline, following both EUR/USD and GBP/USD.
-
Finally, AUD/USD lags and catches up with the rest.
This cascading effect signals strong directional momentum and provides a scalping opportunity—especially when the pairs move in this sequence.
In risk-on scenarios, the same sequence applies in reverse:
-
EUR/USD rises first, followed by GBP/USD, then NZD/USD, and finally AUD/USD.
Due to their strong correlation, EUR/USD and GBP/USD tend to lead these movements and offer the earliest confirmation of a trend shift, making them valuable indicators for spotting potential entries.
-
- Note: Stander stop loss and take profit for 3 minutes chart per trade on Currencies are 15 pips stop and 15 pips profit. If volatility is low or Vix is below 15. If vix is above 20 the stander stop loss and take profit will change from 25 pips stop and 25 pips profit. The first target is always 1:1 and if lag is bigger then target can be changed to 1:2 or 1:3 depending on the setup and lag.
- Chart setup


This strategy is essentially a form of intermarket analysis, where you study relationships between various markets or assets to find opportunities.
Below is a list of commonly observed leading assets across various markets:
1. Currency Markets:
-
EUR/USD: Often leads in the forex market due to the size of the Eurozone and U.S. economies. EUR/USD movements can influence other major currency pairs, such as GBP/USD or AUD/USD.
-
USD/JPY: Given its sensitivity to global risk sentiment, USD/JPY can act as a leading indicator for other currency pairs during times of market stress.
-
AUD/USD: Closely tied to commodity markets (especially metals like Gold and Silver) and China’s economy, the Australian dollar often leads emerging market currencies.
2. Commodities:
-
Gold (XAU/USD): Often seen as a leading indicator of inflation or geopolitical risk. When gold prices rise, it can signal investor fear, which may lead to a sell-off in risk assets like stocks.
-
Oil (WTI or Brent Crude): Crude oil prices often lead the stock prices of oil companies and energy-related sectors. Oil movements can also signal future economic activity, especially for economies dependent on energy.
-
Copper (HG): Known as “Dr. Copper” because of its historical role in predicting economic growth. Rising copper prices can indicate improving global industrial demand and thus signal growth in industrial and emerging markets.
3. Stock Market Indices:
-
S&P 500 Futures: Pre-market movements in S&P 500 futures can act as a leading indicator for how U.S. stocks will open. It is also watched as a barometer for global market sentiment.
-
Nikkei 225 (Japan): As one of the first major indices to open in the trading day, the Nikkei can give early signals for the performance of Asian markets and may provide clues about how U.S. and European markets will open.
-
DAX (Germany): The DAX can sometimes lead other European indices (like the FTSE 100) due to the size and influence of the German economy.
4. Bonds and Interest Rates:
-
U.S. Treasury Yields (10-Year or 2-Year): Bond yields, especially U.S. Treasuries, are closely watched as leading indicators of economic growth and inflation expectations. Rising yields can signal higher inflation or expectations of tighter monetary policy, which can affect equities, currencies, and commodities. (USDJPY specially)
-
German Bund Yields: In Europe, the German bund yield is considered a key leading indicator of monetary policy expectations and risk sentiment for the Eurozone.
5. Commodities vs. Commodity Stocks:
-
Commodity Prices vs. Stocks: Prices of raw commodities like oil, copper, and gold often lead the stocks of companies that produce them. For instance, rising oil prices typically lead to a rise in oil companies’ stock prices.
6. Economic Indicators:
-
ISM Manufacturing Index (U.S.): This economic indicator is often seen as a leading indicator of future economic activity and corporate earnings.
-
Initial Jobless Claims (U.S.): Rising or falling jobless claims can provide early indications of changes in labor market conditions and broader economic health.
7. Global Markets:
-
Shanghai Composite (China): Movements in Chinese stock markets can often lead commodities like iron ore, copper, and coal due to China’s significant role in global commodity demand.
-
Emerging Market Currencies (e.g., Mexican Peso – MXN): Emerging market currencies can sometimes act as leading indicators of global risk sentiment, particularly when tied to commodities or global growth expectations.
8. Cryptocurrencies:
-
Bitcoin (BTC): Bitcoin’s movements can sometimes lead the broader cryptocurrency market. A significant rise or fall in Bitcoin often sets the trend for other cryptocurrencies like Ethereum, Ripple, and altcoins.( US equities follow the BTC specially US100 as it is tech stock as BTC moves over the weekend and gives a hint where the equites will go when market opens)
9. Sector Leading Stocks:
-
Financial Stocks: Large banks and financial institutions (e.g., JPMorgan, Goldman Sachs) often lead the broader market, especially during times of economic change, as they are closely tied to interest rates and economic growth.
-
Tech Stocks (e.g., Apple, Microsoft): Large tech companies, especially in the U.S., have historically led market recoveries and downturns due to their market influence and growth potential.
-
Consumer Discretionary (e.g., Amazon): These stocks can act as leading indicators of consumer sentiment and economic strength, as people tend to spend more in good economic times.
10. Other Assets:
-
Volatility Index (VIX): Known as the “fear gauge,” the VIX often rises before major stock market declines, signaling increased fear or uncertainty in the markets.
-
Real Estate Prices: Real estate, particularly housing prices, can act as a leading indicator of economic strength, as rising prices often precede broader economic growth.
Conclusion:
The key to using leading assets effectively is understanding the relationships and correlations between them and other markets. Traders often use these assets as part of a broader intermarket analysis strategy ( Watching 100 of charts at one time using multiple screens)to gain insights into where the markets might be headed.
Register